- Page 1
- Page 2
- Page 3
- Page 4
- Page 5
- Page 6
- Page 7
- Page 8
- Page 9
- Page 10
- Page 11
- Page 12
- Page 13
- Page 14
- Page 15
- Page 16
- Page 17
- Page 18
- Page 19
- Page 20
- Page 21
- Page 22
- Page 23
- Page 24
- Page 25
- Page 26
- Page 27
- Page 28
- Page 29
- Page 30
- Page 31
- Page 32
- Page 33
- Page 34
- Page 35
- Page 36
- Page 37
- Page 38
- Page 39
- Page 40
- Page 41
- Page 42
- Page 43
- Page 44
- Page 45
- Page 46
- Page 47
- Page 48
- Page 49
- Page 50
- Page 51
- Page 52
- Page 53
- Page 54
- Page 55
- Page 56
- Page 57
- Page 58
- Page 59
- Page 60
- Page 61
- Page 62
- Page 63
- Page 64
- Page 65
- Page 66
- Page 67
- Page 68
- Page 69
- Page 70
- Page 71
- Page 72
- Page 73
- Page 74
- Page 75
- Page 76
- Page 77
- Page 78
- Page 79
- Page 80
- Flash version
© UniFlip.com
Results of Operations
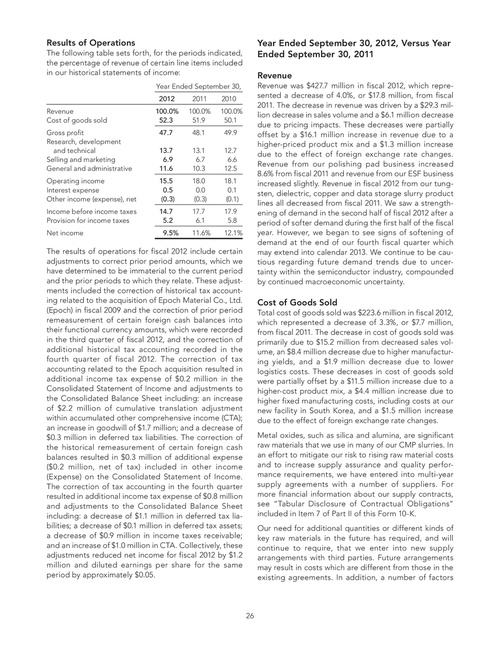
The following table sets forth, for the periods indicated, the percentage of revenue of certain line items included in our historical statements of income:
Year Ended September 30, 2012 Revenue Cost of goods sold Gross profit Research, development and technical Selling and marketing General and administrative Operating income Interest expense Other income (expense), net Income before income taxes Provision for income taxes Net income 100.0% 52.3 47.7 13.7 6.9 11.6 15.5 0.5 (0.3) 14.7 5.2 9.5% 2011 100.0% 51.9 48.1 13.1 6.7 10.3 18.0 0.0 (0.3) 17.7 6.1 11.6% 2010 100.0% 50.1 49.9 12.7 6.6 12.5 18.1 0.1 (0.1) 17.9 5.8 12.1%
Year Ended September 30, 2012, Versus Year Ended September 30, 2011
Revenue
Revenue was $427.7 million in fiscal 2012, which represented a decrease of 4.0%, or $17.8 million, from fiscal 2011. The decrease in revenue was driven by a $29.3 million decrease in sales volume and a $6.1 million decrease due to pricing impacts. These decreases were partially offset by a $16.1 million increase in revenue due to a higher-priced product mix and a $1.3 million increase due to the effect of foreign exchange rate changes. Revenue from our polishing pad business increased 8.6% from fiscal 2011 and revenue from our ESF business increased slightly. Revenue in fiscal 2012 from our tungsten, dielectric, copper and data storage slurry product lines all decreased from fiscal 2011. We saw a strengthening of demand in the second half of fiscal 2012 after a period of softer demand during the first half of the fiscal year. However, we began to see signs of softening of demand at the end of our fourth fiscal quarter which may extend into calendar 2013. We continue to be cautious regarding future demand trends due to uncertainty within the semiconductor industry, compounded by continued macroeconomic uncertainty.
The results of operations for fiscal 2012 include certain adjustments to correct prior period amounts, which we have determined to be immaterial to the current period and the prior periods to which they relate. These adjustments included the correction of historical tax accounting related to the acquisition of Epoch Material Co., Ltd. (Epoch) in fiscal 2009 and the correction of prior period remeasurement of certain foreign cash balances into their functional currency amounts, which were recorded in the third quarter of fiscal 2012, and the correction of additional historical tax accounting recorded in the fourth quarter of fiscal 2012. The correction of tax accounting related to the Epoch acquisition resulted in additional income tax expense of $0.2 million in the Consolidated Statement of Income and adjustments to the Consolidated Balance Sheet including: an increase of $2.2 million of cumulative translation adjustment within accumulated other comprehensive income (CTA); an increase in goodwill of $1.7 million; and a decrease of $0.3 million in deferred tax liabilities. The correction of the historical remeasurement of certain foreign cash balances resulted in $0.3 million of additional expense ($0.2 million, net of tax) included in other income (Expense) on the Consolidated Statement of Income. The correction of tax accounting in the fourth quarter resulted in additional income tax expense of $0.8 million and adjustments to the Consolidated Balance Sheet including: a decrease of $1.1 million in deferred tax liabilities; a decrease of $0.1 million in deferred tax assets; a decrease of $0.9 million in income taxes receivable; and an increase of $1.0 million in CTA. Collectively, these adjustments reduced net income for fiscal 2012 by $1.2 million and diluted earnings per share for the same period by approximately $0.05.
Cost of Goods Sold
Total cost of goods sold was $223.6 million in fiscal 2012, which represented a decrease of 3.3%, or $7.7 million, from fiscal 2011. The decrease in cost of goods sold was primarily due to $15.2 million from decreased sales volume, an $8.4 million decrease due to higher manufacturing yields, and a $1.9 million decrease due to lower logistics costs. These decreases in cost of goods sold were partially offset by a $11.5 million increase due to a higher-cost product mix, a $4.4 million increase due to higher fixed manufacturing costs, including costs at our new facility in South Korea, and a $1.5 million increase due to the effect of foreign exchange rate changes. Metal oxides, such as silica and alumina, are significant raw materials that we use in many of our CMP slurries. In an effort to mitigate our risk to rising raw material costs and to increase supply assurance and quality performance requirements, we have entered into multi-year supply agreements with a number of suppliers. For more financial information about our supply contracts, see “Tabular Disclosure of Contractual Obligations” included in Item 7 of Part II of this Form 10-K. Our need for additional quantities or different kinds of key raw materials in the future has required, and will continue to require, that we enter into new supply arrangements with third parties. Future arrangements may result in costs which are different from those in the existing agreements. In addition, a number of factors
26