- Page 1
- Page 2
- Page 3
- Page 4
- Page 5
- Page 6
- Page 7
- Page 8
- Page 9
- Page 10
- Page 11
- Page 12
- Page 13
- Page 14
- Page 15
- Page 16
- Page 17
- Page 18
- Page 19
- Page 20
- Page 21
- Page 22
- Page 23
- Page 24
- Page 25
- Page 26
- Page 27
- Page 28
- Page 29
- Page 30
- Page 31
- Page 32
- Page 33
- Page 34
- Page 35
- Page 36
- Page 37
- Page 38
- Page 39
- Page 40
- Page 41
- Page 42
- Page 43
- Page 44
- Page 45
- Page 46
- Page 47
- Page 48
- Page 49
- Page 50
- Page 51
- Page 52
- Page 53
- Page 54
- Page 55
- Page 56
- Page 57
- Page 58
- Page 59
- Page 60
- Page 61
- Page 62
- Page 63
- Page 64
- Page 65
- Page 66
- Page 67
- Page 68
- Page 69
- Page 70
- Page 71
- Page 72
- Page 73
- Page 74
- Page 75
- Page 76
- Page 77
- Page 78
- Page 79
- Page 80
- Flash version
© UniFlip.com
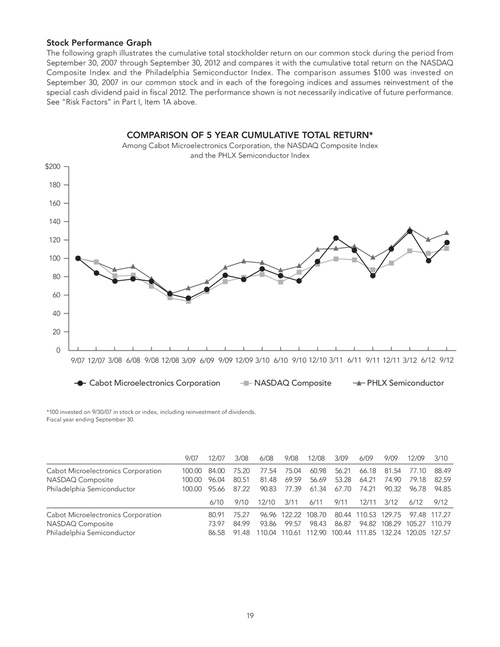
Stock Performance Graph
The following graph illustrates the cumulative total stockholder return on our common stock during the period from September 30, 2007 through September 30, 2012 and compares it with the cumulative total return on the NASDAQ Composite Index and the Philadelphia Semiconductor Index. The comparison assumes $100 was invested on September 30, 2007 in our common stock and in each of the foregoing indices and assumes reinvestment of the special cash dividend paid in fiscal 2012. The performance shown is not necessarily indicative of future performance. See “Risk Factors” in Part I, Item 1A above.
COMPARISON OF 5 YEAR CUMULATIVE TOTAL RETURN*
Among Cabot Microelectronics Corporation, the NASDAQ Composite Index and the PHLX Semiconductor Index
$200 180 160 140 120 100 80 60 40 20 0 9/07 12/07 3/08 6/08 9/08 12/08 3/09 6/09 9/09 12/09 3/10 6/10 9/10 12/10 3/11 6/11 9/11 12/11 3/12 6/12 9/12
Cabot Microelectronics Corporation
NASDAQ Composite
PHLX Semiconductor
*100 invested on 9/30/07 in stock or index, including reinvestment of dividends. Fiscal year ending September 30.
9/07 Cabot Microelectronics Corporation NASDAQ Composite Philadelphia Semiconductor
12/07
3/08 75.20 80.51 87.22 9/10
6/08 77.54 81.48 90.83 12/10
9/08 75.04 69.59 77.39 3/11
12/08 60.98 56.69 61.34 6/11
3/09 56.21 53.28 67.70 9/11
6/09 66.18 64.21 74.21 12/11
9/09 81.54 74.90 90.32 3/12
12/09 77.10 79.18 96.78 6/12
3/10 88.49 82.59 94.85 9/12
100.00 84.00 100.00 96.04 100.00 95.66 6/10
Cabot Microelectronics Corporation NASDAQ Composite Philadelphia Semiconductor
80.91 73.97 86.58
75.27 96.96 122.22 108.70 80.44 110.53 129.75 97.48 117.27 84.99 93.86 99.57 98.43 86.87 94.82 108.29 105.27 110.79 91.48 110.04 110.61 112.90 100.44 111.85 132.24 120.05 127.57
19